Open topic with navigation
Restaurant Reports
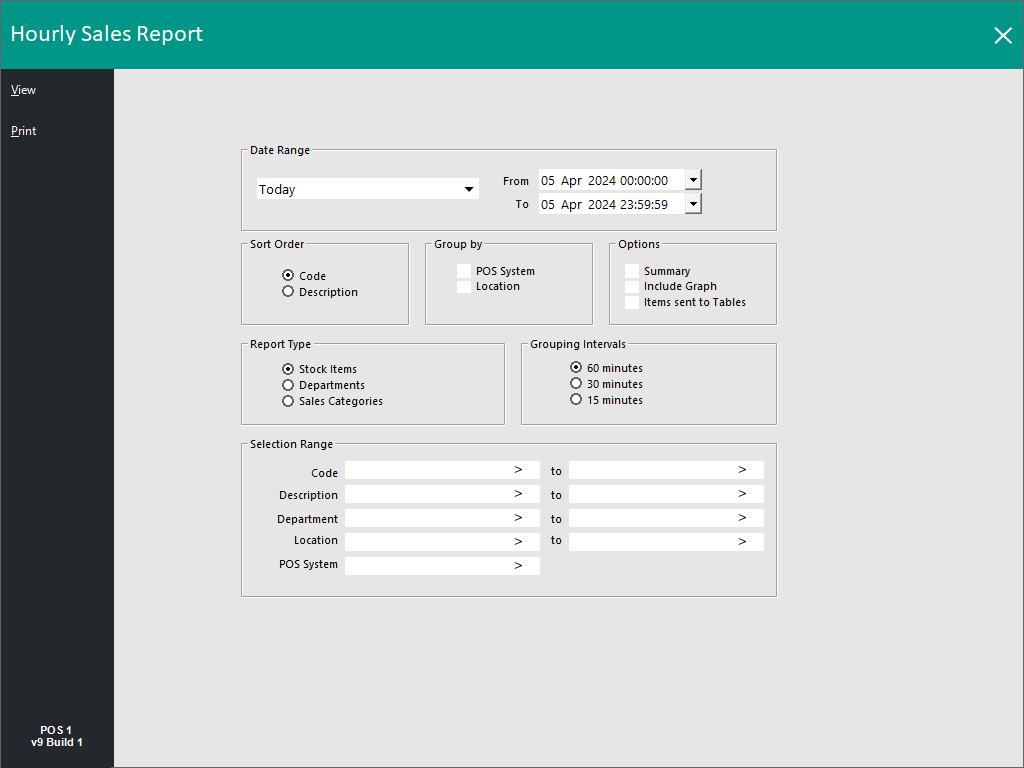
Hourly Sales
This report will give you the following options:
- Date Range
- Sort Order – Code, Description
- Group By – POS System, Location
- Options – Summary, Include Graph, Items sent to Tables
- Report Type – Stock Items, Departments, Sales Categories
- Grouping Intervals – 60 minutes, 30 minutes, 15 minutes
This report will display the selected sales by the Hour.
Restaurant Reports
Go to Reports > Restaurant Reports
There is only two reports available in the Restaurant group which are:
- Covers Spend Report
- Covers by Session
Covers Spend Report
This report is used to get more information from the sales performed within a restaurant.
The report is not limited to restaurants, but as it is based on Covers, restaurants will see the most benefits.
Yes/No Options
If you cannot see the ‘Restaurant’ selection, you may not have ‘Restaurant Reports’ enabled.
Go to Setup > Yes/No Options > Restaurant > Show Restaurant Reports.

If you are a restaurant and want to make sure that covers are prompted on each table, you can have this as default.
Tables can have a default number of covers.
If the covers on the table are different to the default number, staff will need to modify the number of covers manually
Go to Setup > Yes/No Options > Restaurant > Prompt for Covers.

Global Options
To fully utilise the report, it is a good idea to setup ‘Sessions’ for the different time periods during the day.
Sessions can be split into hours only during the day and need to overlap for best results.
Go to Setup > Global Options > Restaurant > Sessions.
The Covers Spend Report offers the following selections:
Date Range:
- From - Select the from date you want the report to run ‘From’. The report will only display 28 days (4 weeks) of data.
- To - This is a read-only date field that is calculated to be 28 days after the date selected in the 'From' field above.
Show Report Sections:
- Daily Covers Grouped by Session – This will display the Covers for the entire day broken into each Session.
- Food/Beverage Totals Grouped by Week – This will display the Food/Beverage Totals for the entire week.
- Covers/Averages Grouped by Week – This will display the Covers/Averages for the entire week.
- Department Totals Grouped by Week - When enabling this checkbox, a field will appear which is used to select one or more Departments. The Departments can be a range e.g. 1-3, 5, 7-9.
Calculations:
Calculate Covers from:
- Restaurant Covers – When Covers have been used from the Table Map only.
- Quantity of Items Sold in Departments - When enabling this option, a field will appear which is used to select one or more Departments. The Departments can be a range e.g. 1-3, 5, 7-9.
Calculate Covers Spend Amount from:
- Restaurant Sales Only – Only includes sales that have been fully processed while using the Table Map. The Table must be paid off through the table and not as a cash sale attributed to a table.
- Amounts Spent in Departments - When enabling this option, a field will appear which is used to select one or more Departments. The Departments can be a range e.g. 1-3, 5, 7-9.
- Show Nett Ex-Tax – Will not show the Food/Beverage/Other totals as Ex-Tax but all the other amounts will be. (Only if "Restaurant Sales Only" is ticked, if either of the other two are ticked this won't apply – i.e. all amounts will be shown ex-tax (except for Gross)).
Guests by Session
This report will give you the following options:
- Date Range
- Group By – Table, Table Map
- Options – Include Graph on Report, Don’t Show Intervals, 60 minutes, 30 minutes, 15 minutes
- Selection Range – Table, Table Map
This report will provide you the number of guests in the restaurant by session.
Open topic with navigation


